Shenandoah · Miami, Florida
Shenandoah, Miami — What the Market Actually Did
Shenandoah is a 1919-platted neighborhood between Calle Ocho and Coral Way. Over the 12 months to August 31, 2026, 116 houses and townhouses closed at a median $947,500 — $545 per square foot — in a median 64 days.
Data: closed, pending, active and off-market records · 12 months to August 31, 2026 · Updated monthly
Shenandoah at a glance
The neighborhood
Where exactly is Shenandoah?
Shenandoah runs south of Calle Ocho (SW 8th Street) to Coral Way, and from SW 12th Avenue west to SW 27th Avenue — ZIP codes 33135 and 33145, between Little Havana and Coral Gables.
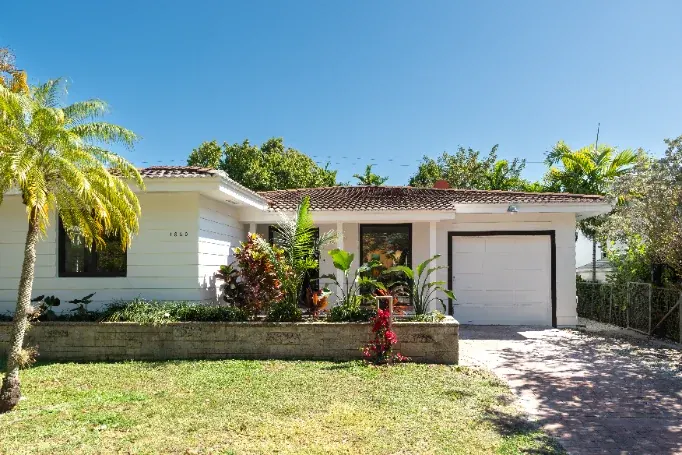
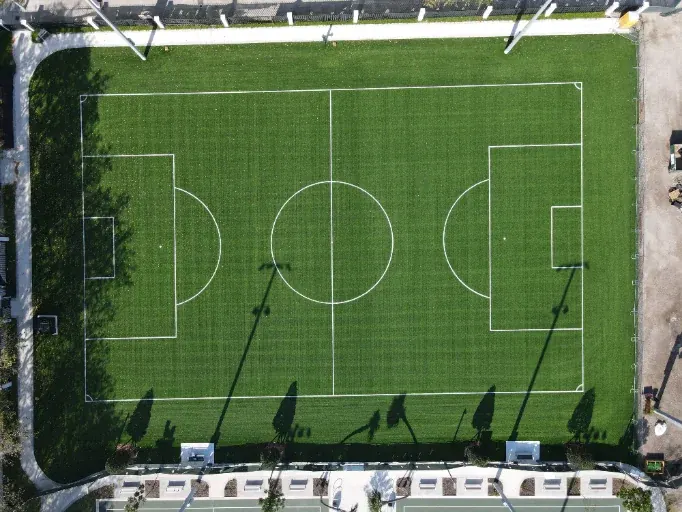
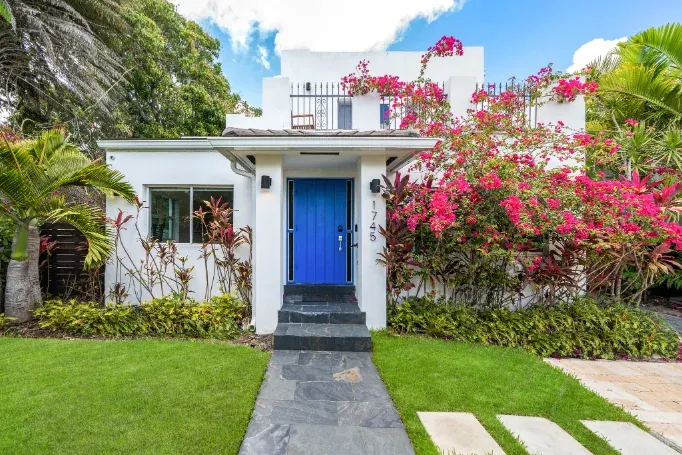
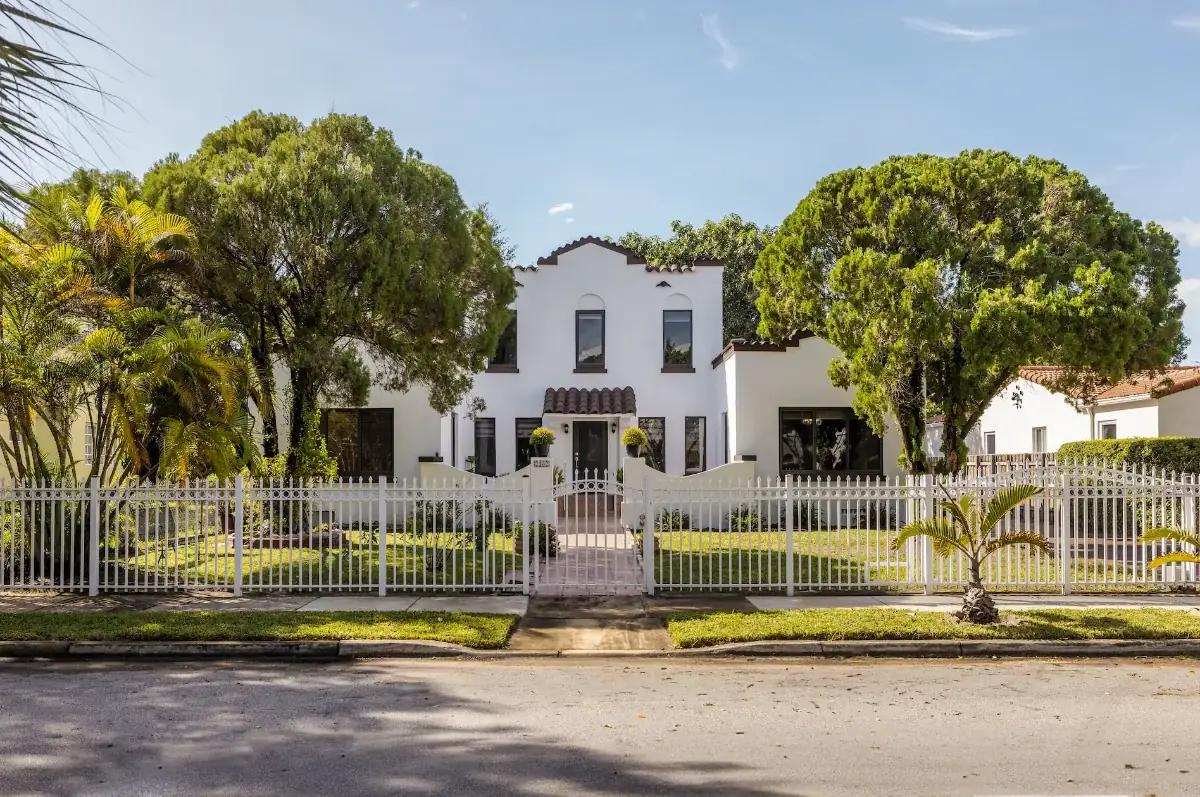
It was platted in 1919 by developers from Virginia — the name comes from the Shenandoah Valley — and built out through the 1920s land boom. The typical home that sold over the last year was built in 1939: Mediterranean Revival, Mission-style, and frame-vernacular houses on roughly 6,068-square-foot lots, with Shenandoah Park at the neighborhood’s center.
The full neighborhood reference — zoning, plats, housing stock, walkability →
The number that decides the sale
What happens to homes that cut their price?
Median days on market. Sold at 96% of the original asking price.
Median days on market. Sold at 86% of the original asking price.
Direct answer: Shenandoah homes that never cut their price sold for 96% of asking in a median 24 days. Homes that cut sold for 86% of their original asking price and took 113 days.
| Measure | Never cut (67 homes) | Cut at least once (49 homes) |
|---|---|---|
| Share of original asking achieved | 96% | 86% |
| Median days on market | 24 | 113 |
Scroll table horizontally →
The launch price is the decision that matters. The 49 homes that repriced didn’t just take five extra months — they surrendered ten points of the original ask along the way.
Shenandoah, photographed
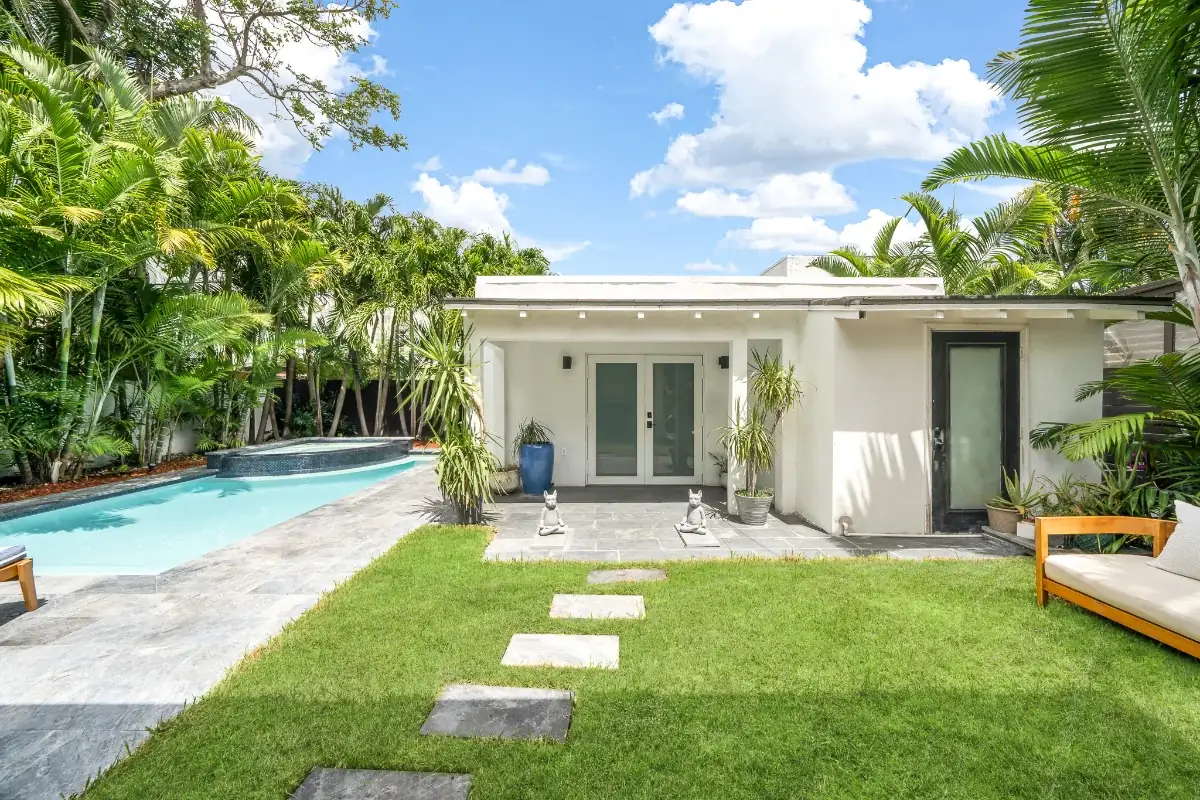
Trailing twelve months
Market at a glance
| Measure | 12 mo to August 31, 2026 | Prior 12 mo |
|---|---|---|
| Houses/townhouses sold | 116 | 118 |
| Median sale price | $947,500 | $900,000 |
| Median price per sq ft | $545 | $565 |
| Median days on market | 64 | 66 |
| Sale price vs original asking | 92% | 92% |
| Sold at or above final asking | 22% | 17% |
| For sale now | 62 | — |
| Months of supply | 6.4 | — |
| Typical home sold | 3 bed · 1,828 sq ft · 6,068 sq ft lot · built 1939 | — |
Scroll table horizontally →
Volume, pricing, and pace all sit within a point or two of last year — the negotiation happens listing by listing, not market-wide. The spread that matters is below.
Half of Shenandoah listings don’t sell
Direct answer: Over the same 12 months, 116 listings sold and 130 came off the market unsold — 89 cancelled, 35 expired, 6 withdrawn. The median failed listing asked $1,299,500, sat 132 days, and priced about 17% above what sold homes achieved per square foot.
A 50% failure rate is not a soft market — the sold half moved in 64 days at 92% of ask. It is a mispricing rate. The two halves asked different numbers for the same neighborhood, and the market answered one of them.
One neighborhood, two markets
| Price band | Sold (12 mo) | For sale now | Months of supply | Median days |
|---|---|---|---|---|
| Under $750k | 28 | 11 | 4.7 | 31 |
| $750k–$1M | 36 | 11 | 3.7 | 50 |
| $1M–$1.5M | 30 | 19 | 7.6 | 92 |
| $1.5M–$2M | 12 | 15 | 15.0 | 80 |
| $2M–$3M | 9 | 6 | 8.0 | 208 |
| $3M+ | 1 | 0 | — | — |
Scroll table horizontally →
$750k–$1M is the neighborhood’s clearing price — 3.7 months of supply (how long the band’s standing inventory would last at its current sales pace) and roughly two-month sales. The $1.5M–$2M band is carrying 15 active listings against 12 sales a year: about 15.0 months of supply. A seller entering that band competes with a standing queue of inventory; a buyer in it holds the leverage.
Browse the 62 homes currently for sale in Shenandoah on the map, or read the short answers on the FAQ.
The 1920s house and the 2020s house
| Housing stock | Sold (24 mo) | Median price | Median $/sq ft |
|---|---|---|---|
| Built before 1940 | 111 | $883,000 | $519 |
| Built 1940–1979 | 81 | $860,000 | $550 |
| Built 1980 or later | 42 | $1,592,500 | $645 |
Scroll table horizontally →
Within the same blocks, buyers paid $645 per square foot for post-1980 construction against $519 for the pre-1940 stock — the renovation-and-rebuild economics of this neighborhood in one row. Both figures cover houses and townhouses inside the same boundary: a within-neighborhood, within-type comparison.
East of 17th, west of 17th
The dividing line runs down SW 17th Avenue. To its east (SW 12th–17th Avenues), 24 months produced 106 sales at a median $972,500 in 74 days; to its west (18th–27th), 128 sales at $872,500 in 58 days. Per square foot the halves are nearly interchangeable — what differs is the product: larger homes and longer marketing east of the avenue, smaller homes clearing faster west of it. A comparable pulled from the wrong half misprices a listing before the first showing.
Latest closings
| Address | Sold price | % of original ask | $/sq ft | Days | Closed |
|---|---|---|---|---|---|
| 2153 SW 13th St | $1,520,000 | 102% | $531 | 5 | Aug 2026 |
| 2212 SW 22nd Ave | $1,050,000 | 100% | $611 | 50 | Aug 2026 |
| 2225 SW 18th Ave | $2,350,000 | 91% | $630 | 90 | Aug 2026 |
| 1735 SW 15th St | $1,000,000 | 87% | $438 | 84 | Aug 2026 |
| 2257 SW 11th St | $695,000 | 87% | $463 | 39 | Aug 2026 |
| 1366 SW 15th St | $2,350,000 | 91% | $797 | 236 | Aug 2026 |
| 2110 SW 15th St | $860,000 | 96% | $624 | 47 | Aug 2026 |
| 1450 SW 25th Ave | $890,000 | 102% | $494 | 14 | Jul 2026 |
Scroll table horizontally →
Sales below $10,000 and non-arm’s-length transfers are excluded. Properties shown were listed or sold by various participants in the MLS and are not necessarily the listings or sales of Gatien Salaun or Coldwell Banker Realty. Every month, sale by sale: the monthly report.
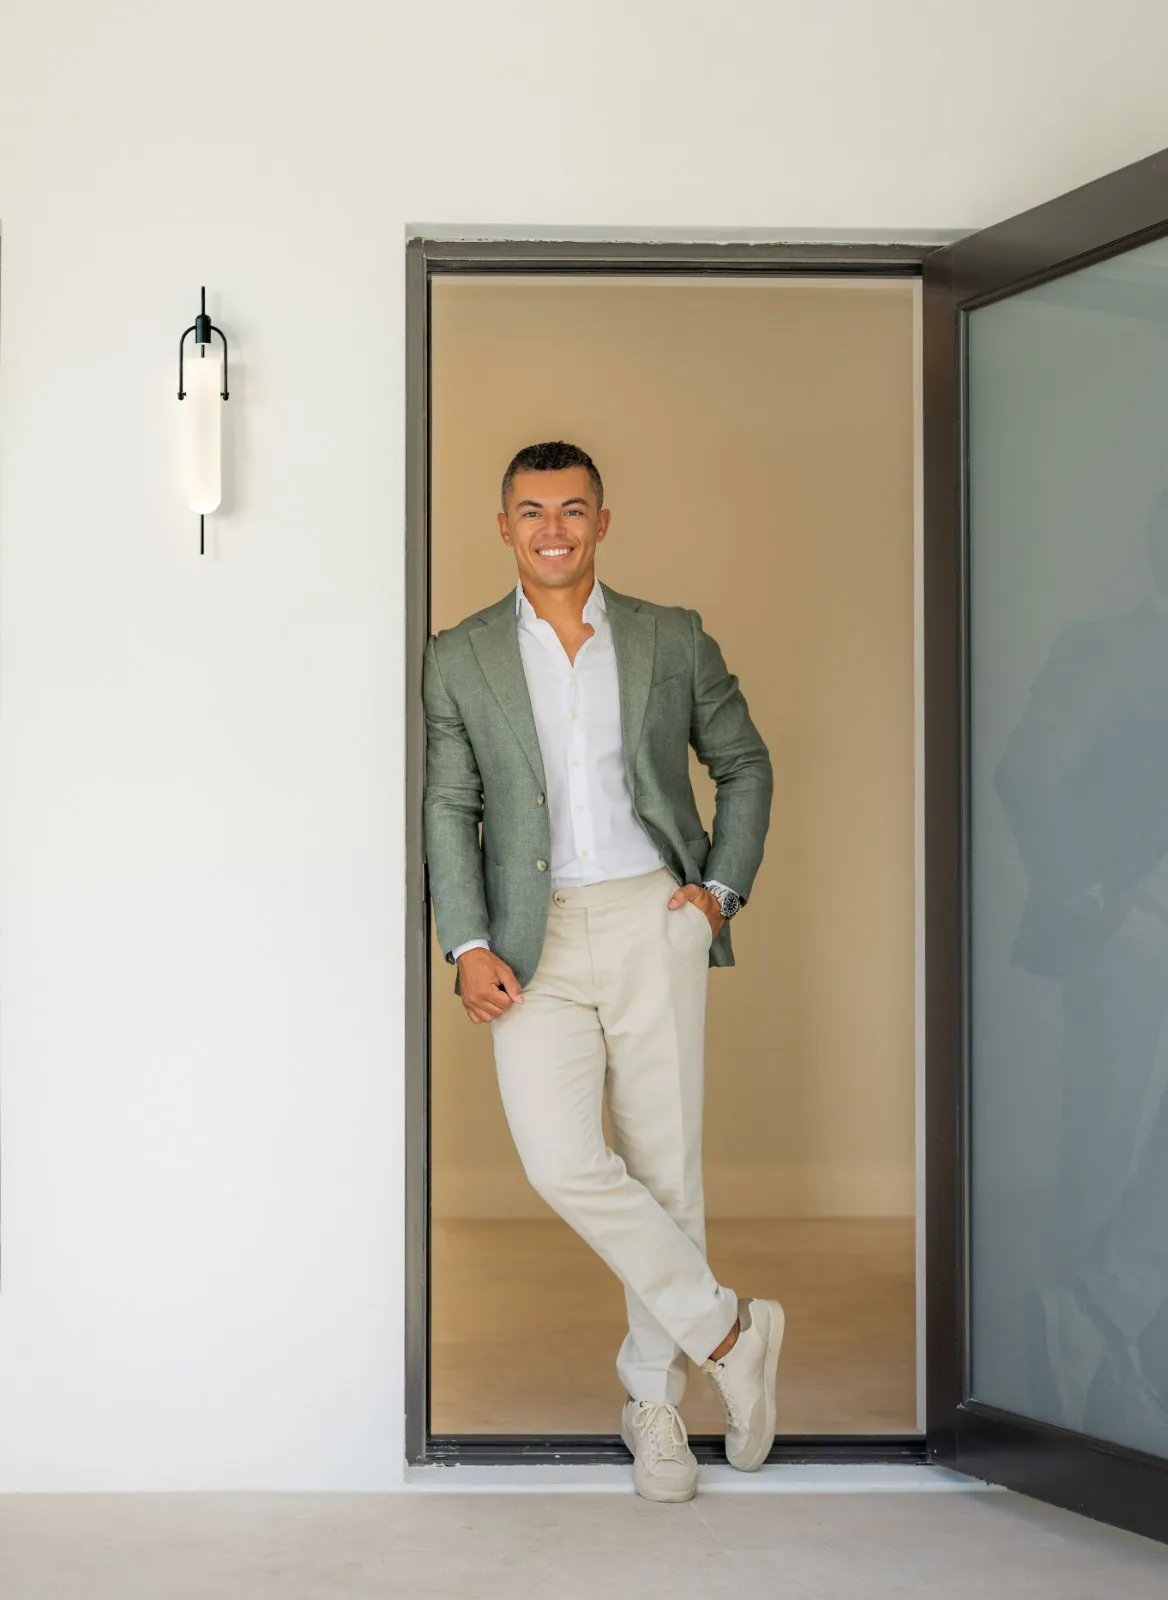
About Gatien
The advisor behind the numbers/
I’m Gatien Salaun, a real estate advisor with Coldwell Banker Realty in Miami Beach. Ten years in Miami residential real estate, $71M+ closed across 193 transactions, in English and French.
I publish this site’s reports whether or not I’m the agent on a given closing — tracking the market and transacting in it are different things. I’ve been active in the Shenandoah corridor since 2022, and I publish this neighborhood’s market report every month — 35 consecutive months and counting.
Keep reading
Three ways into the neighborhood
Direct answer: This site is maintained by Gatien Salaun, a Coldwell Banker Realty advisor with ten years in Miami residential real estate and $71M+ closed across 193 transactions, who has bought, sold and leased in Shenandoah and the Coral Way corridor since 2022 and publishes this neighborhood’s market report every month. The record, deal by deal → /about.
A written valuation, not an estimate
For a Shenandoah home, an automated estimate misses what moves the number here: the zoning layer, the plat, the vintage, and the price-cut history of the comparable pool. A written valuation runs the same data this site publishes — for one specific address.