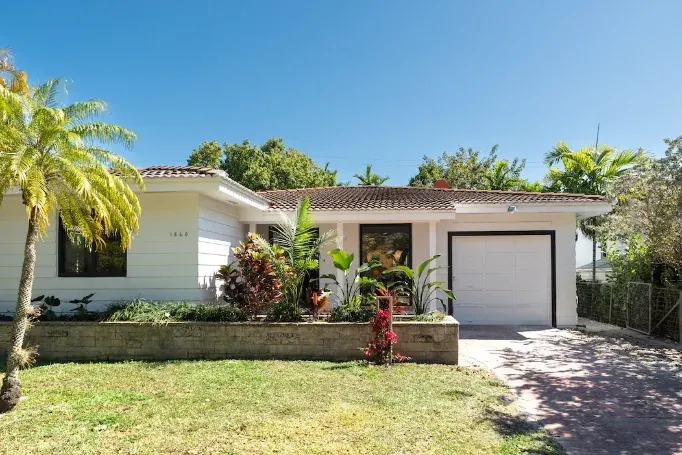
Editor's note (August 2026): Quarterly recaps published before August 2026 used a narrower core-plats cut of the neighborhood. The site's Monthly Report series now uses the full civic boundary of Shenandoah — SW 8th Street to Coral Way, SW 12th to SW 27th Avenue. This report is preserved as written.
Eleven single-family homes closed in Shenandoah between April 1 and June 30, 2026. That is a small enough number that every sale moves the numbers, which is exactly why the headline figures need context, not just a citation. Here is what actually happened this quarter, and what I'd tell a client sitting on either side of a Shenandoah transaction right now.
Geography: Shenandoah, bounded roughly by Calle Ocho (SW 8th St) to the north, Coral Way to the south, SW 12th Avenue to the east, and SW 27th Avenue to the west (ZIPs 33135/33145). Single-family houses only — this is a house market, not a condo one.
The headline numbers
| Metric | Q2 2026 | Q2 2025 | Change |
|---|---|---|---|
| Closed sales | 11 | 8 | +37.5% |
| Median sale price | $870,000 | $1,161,250 | -25.1% |
| Median price per sq. ft. | $562.13 | $575.66 | -2.4% |
| Median days on market (CDOM) | 64 | 43.5 | +20.5 days |
| Sale-to-original-list ratio | 89% | 90.5% | -1.5 pts |
| Sold at or above list | 0% | 0% | — |
Why the median price reads down 25% — and why that's not the real story
A 25% year-over-year drop in the median sale price looks dramatic. The price-per-square-foot column tells a calmer story: down 2.4%. That gap is the tell.
Look at what actually traded. In Q2 2025, 12.5% of closings landed in the $2M–$5M band. In Q2 2026, that band was empty — zero closings above $2M. One or two high-end sales pulled last year's median up; this year's trade mix simply skewed smaller. Price-per-square-foot strips that mix effect out, and it moved a fraction of what the median did. The honest read on Q2 2026: value per square foot held close to flat, while the composition of what actually closed shifted toward more modest homes.
A market splitting into two speeds
The quarter's most interesting number isn't the median — it's the split between the fast pocket and the stale pocket.
Within Shenandoah, the "South Shenandoah" plat closed three homes at a median $487/sq. ft. in a median 21 days, up 11.7% year-over-year on price-per-square-foot. The core "Shenandoah" plat also closed three homes, but at $562/sq. ft. and a much slower 58-day median.
Meanwhile, active inventory tells the other half of the story: 13 homes are currently on the market, median 99.5 days on market, and 46% have already sat past 120 days with 46% carrying at least one price cut. That's not a market that's soft everywhere — it's a market where correctly priced homes in the right pocket move in three weeks, and everything else is sitting.
One data point worth flagging on its own: 1786 SW 14th Terrace, a Marlborough-plat home, closed April 10 at $785,000 — $616.17 per square foot, a 5.1% premium over the prior recorded high for that pocket (set across six prior sales in the store). Renovated, well-positioned product is still setting records here even as the broader median softens.
What's in contract right now
Four homes are pending. Median ask: $2,495,000 — a meaningfully higher price point than anything that actually closed this quarter. Recent sale-to-list performance on comparable pendings runs 95%, which implies a median close near $2,370,000 if that ratio holds. These are 75% 4BR+ homes, and the median time from list to contract was 62 days.
If these close near that implied number, Q3's median will look nothing like Q2's — another reminder that a segment this size shouldn't be read quarter-to-quarter as a smooth trend line.
The off-market number that matters more than the sold number
Over the trailing twelve months, 103 Shenandoah single-family listings did not sell — 71 cancelled, 29 expired, 3 withdrawn. Median list price on those: $1,299,000. Just under 36% carried a price reduction before coming off market, at a median cut of 8.7%.
Set that against 11 actual closings this quarter. For every home that traded, roughly nine failed to trade over the trailing year. That ratio is the single clearest argument for pricing a Shenandoah listing to the data on day one rather than testing the market — the failed-listing pool is not a fringe outcome here, it's close to the norm.
Rent vs. buy, quarter by quarter
Nine leases closed against 11 sales this quarter — a 0.73 lease-to-sale ratio, down from 1.22 in Q4 2025, when leases actually outpaced sales. Median rent held flat at $4,300 for a third straight quarter. Read together with the sales data, more owners chose to sell than to lease out this quarter compared to late last year — consistent with a market where sellers are motivated enough to test pricing rather than sit on rental income.
FAQ
What is the median home price in Shenandoah, Miami right now?
$870,000 for single-family homes that closed in Q2 2026 (April–June), based on MLS closing data. Price-per-square-foot, a steadier measure given how few homes sell each quarter, was $562.13.
Is Shenandoah a buyer's or seller's market in mid-2026?
The data points two directions at once. Correctly priced homes in the right pocket (South Shenandoah closed in a median 21 days this quarter) are still moving with limited negotiation. But nearly half of current active listings have sat past 120 days and carry a price cut, and 89% was the median sale-to-list ratio — real room for buyer negotiation on stale inventory.
How long do homes take to sell in Shenandoah?
The quarter's closings carried a median 64 cumulative days on market. Current actives are running a median 99.5 days — a sign that today's for-sale inventory is, on average, sitting longer than what closed last quarter.
How reliable is a median price for a neighborhood this size?
Treat it carefully. With only 11 closings this quarter, one or two high-price sales can move the median 20+ points without the broader market actually shifting. Price-per-square-foot is the steadier number to watch quarter over quarter.
Source: MLS closed, active, and off-market listing data for Shenandoah, Miami, single-family homes, closings dated April 1 – June 30, 2026, with year-over-year comparisons to Q2 2025 and trailing-twelve-month off-market figures. Compiled by Gatien Salaun, Coldwell Banker Realty.